•
Power BI Desktop Update – April 2018
The month of April brings with it some great Power BI news! For those of you who are using Power BI as your self service BI and Analytics tool, you will no doubt welcome these features in your organization. Each month Power BI continues to roll out features requested by the user community. Microsoft takes pleasure in your suggestions and ideas. People post ideas and the community “upvotes” the content they feel is most relevant to their needs and then the team at Microsoft reviews these requests and then has their engineers get to work.
There were two big features that were brought out this month and they are Buttons and Q&A Explorer. In the past you had to assign an image that maybe resembled a button but now you can actually choose a number of default shapes that are provided to you out of the box by Power BI. Why should you care about a button? Strictly from a user experience perspective you can now make your reports more user friendly by adding effects, for example, when you hover over a button it will change color to give your users a way of knowing they can interact further with their report. With regards to the Q&A Explorer this provides another level of depth that your users can enjoy when interacting with their Power BI reports. This feature allows people to ask questions on the data that has been provided in the report by selecting a button.
Let us show you both features to gain an idea of how this works for your organization:
Once you have some data placed on your canvas you will now notice in the ribbon a feature called Buttons. It allows you to select default shapes without having to find ones online or going through the motions of creating your own.
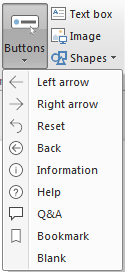
Once you place a button on the screen you can now place a hover effect when your mouse touches the button.
Original Button Customized Button
 Hover feature added to Customized Button
Adding the Q&A Explorer is also a very easy to do. If you select the Q&A button (as shown above) on your report, Power BI will assign it to operate as a tool to ask questions about your data. This is a very welcome feature by many people as this is yet another level of Power BI taking their self service BI tool to the next level.

When you select the button a new window opens up which allows people to ask basic questions and Power BI delivers the results immediately.
We really enjoy looking for ways to improve our clients experiences in Power BI and as new capabilities are added each month it continues to allow us to be more creative with our approaches and it offers you more exciting ways to interact with your data no matter how large or how small.
If you would like to see these and many other features in more detail here is a link for you to review the video posted by Microsoft for April’s 2018 Power BI features.
If you have questions about how we have worked with other organizations and their Power BI needs, and would like to partner with us to help you incorporate these new features and others, please reach out to us on our website or call us toll free at 844-460-8540.