Home / Blog / Insights / Power BI: Data-Driven Culture & High ROI

Power BI: Data-Driven Culture & High ROI
Heading into 2022, companies with a top-tier data culture are performing the best, as almost all (90%) have met or exceeded their revenue goals over the past 12 months. In particular, top-tier companies are more likely to have even exceeded their revenue goals, 50% compared to just 37% among low-tier companies and 41% overall.
Data culture is broken down into 3 key disciplines:
- Data search and discovery: the ability to quickly and easily find the right data for a specific purpose
- Data literacy: the ability to draw valid conclusions from data including understanding the limits of interpretation and awareness of common biases
- Data governance: the overarching process by which data assets are managed to ensure trustworthiness and accountability, including compliance with policies and regulations
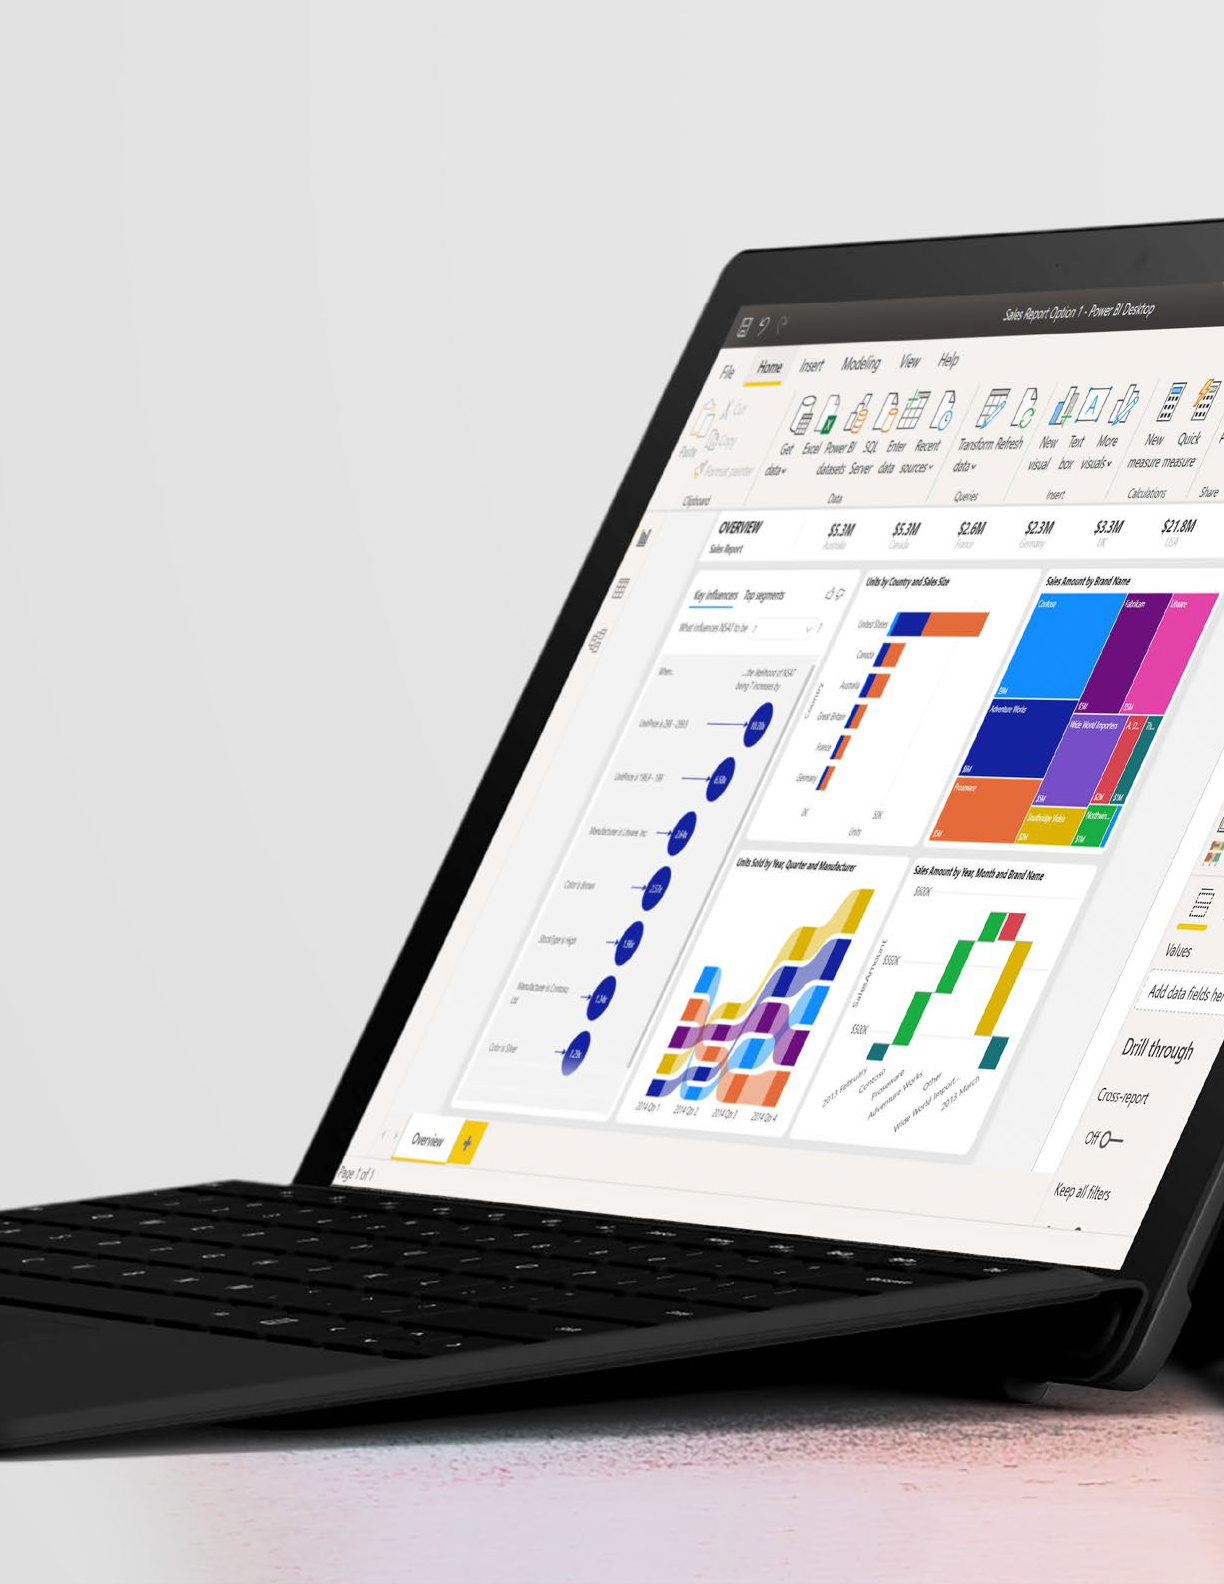
Power BI is positioned in the data culture as an analytics platform which allows people in your organization to start using their data and transforming it into action. In the end, it is all about empowering all employees in your organization to become data-driven.
How is a 366% ROI possible with Power BI?
According to the Forrester Total Economic Impact™ Study, Power BI comes at a lower Total Cost of Ownership (TCO) and a 366 % ROI.
Providing clear, secure access to data insights for all your users is not only easy with Power BI, it’s affordable. Not only did Power BI users get money back, but they also got back valuable time. On average, business users across different roles saved 1.25 hours per week. The study also found that a more “data-driven and data-democratization culture” led employees to feel more empowered because of the meaningful contributions they were making to the organization and overall increased employee satisfaction.
Microsoft is leading the way with Power BI
For the 15th year in a row, The 2022 Gartner Magic Quadrant for Analytics and Business Intelligence Platforms report has named Microsoft a leader in the Analytics and Business Intelligence Platforms. This also marks the third year Microsoft has placed furthest to the right for completeness of vision and closest to the top for ability to execute.
Microsoft is a Leader in this Magic Quadrant. It has massive market reach and momentum through Office 365 and a comprehensive, visionary product roadmap. Microsoft Power BI offers data preparation, visual-based data discovery, interactive dashboards and augmented analytics.
The new “goals” capability enables data-driven and collaborative tracking of key business metric scorecards. Power BI is primarily deployed as a SaaS option running in Azure, but offers a less-functional on-premises option in Power BI Report Server. Microsoft continues to align Power BI closely with Office 365, Microsoft Teams, Excel and SharePoint. In 2022, Microsoft’s vision is to make Power BI the hub for data and analytics in an organization.
Key Strengths
- Alignment with Office 365, Teams and Azure Synapse: The inclusion of Power BI in the Office 365 E5 SKU has provided an enormous channel for the platform’s spread. As many customers turn to Teams for remote work collaboration, the ability to access Power BI and now “goals” within the same Teams interface is a compelling integration for business users. Power BI and Azure Synapse alignment addresses multiple data and analytics personas and use cases.
- Price/value combination: Power BI does not sacrifice quality in order to achieve its disruptively low pricing model. The Power BI cloud service is rich in its capabilities, which include an enlarged set of augmented analytics and automated ML (autoML) capabilities.
- Power portfolio and product ambition: Microsoft has a clear vision for cross-utilization of Power BI, Power Apps and Power Automate to drive business value.
- Power Apps can be embedded in Power BI dashboards or access Power BI datasets, and Power Automate flows can be constructed to take various actions based on the data. AI-powered services, such as text, sentiment and image analytics, are available within Power BI Premium.
Get started now with Power BI
Up until now, you may have navigated your business with limited access to your operations data when making important decisions. But you can’t keep going that way.
Today (and tomorrow) is about being digital. Making sense of your data from anywhere, anytime is key. One answer is Power BI from Microsoft. Power BI is a dashboard and interactive reporting tool, which allows you to quickly and easily transform your data into meaningful insights so you can improve decision making and score better business results.
But where do you start? How do you adopt Power BI into your business? How do you customize it for maximum benefit and value? That’s where we help. Our team of Power BI consultants, support you in a variety of ways from building a data strategy, to adopting or customizing Power BI just for your needs.
Let us get you started with a free consultation. Contact us here.


