Home / Blog / Insights / How To Debug a FAST Search Pipeline Extension

•
How To Debug a FAST Search Pipeline Extension
Developing a FAST Search Pipeline extension for SharePoint FAST Search is a good way to get FAST to crawl custom properties for files that it would not normally crawl. One issue with it is that trying to debug it isn’t intuitive. I am going to give you some pointers on how you can perform this task.
There are two ways you can do this. The first way is to debug using dummy files that are already set up and you pass as arguments into the program. The second way is to debug when a crawl is running.
Option 1:
- Create two files a) output.xml and b) input.xml. Input xml will have the crawled property that you will get your info from. Output will have the crawled properties that you are setting info for.
- Open your fast pipeline application.
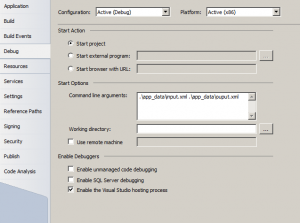
- Edit the properties of your project, and under Debug -> Start Options set the Command line arguments to the location of input.xml and output.xml.

- Set a breakpoint and run your application. Now you can debug using your test files.
Option 2:
- Open your fast pipeline application, in your Main() in Program.cs place
[code language=”csharp”]#if DEBUG
System.Threading.Thread.Sleep(1000*90)
#endif[/code]
- Build your solution and deploy the new code to your FAST Search pipeline location on your local machine.
- Start a full FAST crawl that will use this extension.
- Open Task Manager select the processes tab and wait for yourapplication.exe to show up in the list. If it isn’t showing up, make sure you have ‘Show processes from all users’ selected.
- When your application shows up, go to your solution, Debug -> Attach to Process.
- Find your application in the process list.
- Place a breakpoint after the #endif and wait for the breakpoint to hit.
- Now you will be able to debug the application during a full crawl.
Being able to debug this in Visual Studio will be very beneficial in determining what is going on with your pipeline. I hope this helps!


